Product Management in the Open - Value Hypothesis and KPIs
This post talks about setting a value hypothesis and related KPIs. It’s part of the ‘Product Management in the Open’ series. The goal of the series is describe the process of product managing a mobile app - Best in Town / Best in Edinburgh. Please, check this page to read more about the app itself.
This post describes my thinking back in the beginning of 2017. Not everything I did at that time was correct and I also try to reflect on some of the mistakes here.
Value Hypothesis
Okay, so we’ve got a product idea. But how do we know if it’s a good idea?
Actually, what we've got is called a value hypothesis in the Lean Startup terminology. We just have a hypothesis that people will like the idea of an app that rates meals & drinks as opposed to entire venues.
Build-Measure-Learn Loop
Any hypothesis has to be validated. That takes to another concept from the Lean Startup - 'Build-Measure-Learn' loop.
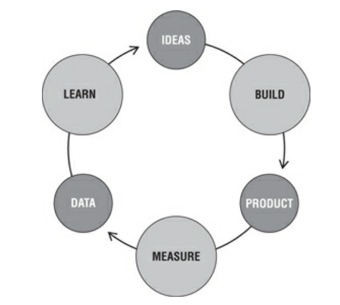
- We come up with an idea
- We define a hypothesis to validate it
- We identify the KPIs that allow us to test the hypothesis
- We build a very minimal product to validate it
- And finally we can either confirm or deny our hypothesis
- Next blog posts though will tell that the process of validating a hypothesis is not as straightforward as it sounds here
Critical Action
So our hypothesis is that people will use Best in Town. Or in other words, they will use a mobile app that shows rates meals & drinks, instead of entire places.
But what does it really mean ‘to use a product’? Does it mean that people download it? Open it? Or do something else?
As we said before, users must get a value out of the product. And that means more than just installing an app or launching it. It means performing a critical action.
A classic example of a critical action is playing a song in a music player app. Indeed, if people open the music player app, but don’t play a song, it means they don’t get a value out of it. Of course, there could be a case when the value users get is different from what the creators perceived. For example, people use the music player app to read lyrics instead of playing songs. And if we can spot that trend, we can change our app, so that it focuses on songs lyrics. Such a change in direction is called pivoting.
When it comes to Best in Edinburgh, the critical action is looking at the place. In other words, someone has chosen a category, for example, ‘Best wine’ and opened any place on the map. That shows that they are looking at the best places to go.
Could There Be Another Critical Action?
If we define a critical action as an the main action that gives a value, then we can take it even further. We can say that a critical action is an act of physically getting to a place after looking it up on Best in Town.
That would be the best indicator if people are finding the app valuable. However, it will be quite challenging to measure that in the context of a Minimum Viable Product (MVP).
KPI - Retention
So, we’ve established the critical action - opening a place. But is it enough to measure? Let’s say all, people who’ve downloaded the app, opened the place - would it tell us that users find it useful? What if they only do it once? What if people only use the app once after installing it? Then, perhaps they don't find the app that useful, after all.
Engagement Apps vs Transactional Ones
To be completely fair, the last statement could be debated. In theory, there can be an app that solves a user's needs once and for all. In that case, it'll be unwise to expect people to come back to the same app again.
Also, there can be products that are transactional in nature - people use them to buy something or order a taxi. Of course, a good retention would be absolutely invaluable for that kind of apps, too. But it may not be the top KPI for them. Instead, a better KPI could be a percentage of people who complete a transaction versus just browsing.
I believe Best in Edinburgh / Best in Town falls into a different category of apps - 'engagement apps' (for the lack of a better word). They meant to be constantly provider a value to a user, albeit not necessarily on daily basis.
Different Kinds of Retention and Usage Patterns
So, what we are looking for is recurring users who keep coming back. We’re looking for user retention. And when it comes to retention there are three different types of it - Daily, Weekly, and Monthly.
In order to choose a retention type we need to understand the usage patterns of the app. It might be tempting to think that people will use your app every day. But that’s very often not the case. There are successful apps that have good retention apps but not used daily. And if the app is not meant for an everyday use, then there’s not much point of looking at daily retention rate. Monthly retention may show a more accurate picture.
Best in Edinburgh fails into that category. It’s not going to be used daily by the same people. There’s a research by QuantCast about Yelp (a similar app/website) that shows that only 25% of users come to it more than once a month.
Plus, there’s also an anecdotal evidence about myself and my friends. We do use Yelp/TripAdvisor/Google Maps for finding new places, but we don’t do it daily.
So, monthly retention is our KPI
Setting KPI (Retention) Goals
But which retention are we looking to get - 100%, 50%, 25%?
At the time when I was setting that goal - early 2016 - I did research on the average monthly retention rate for mobile apps. And I discovered the following.
The Localytics report that said only 36% people, who downloaded an app, used it a month later. Please, note that if you open that report now, it'll show higher retention figures that at that time when I was doing this research. Luckily, I copied this chart back then.
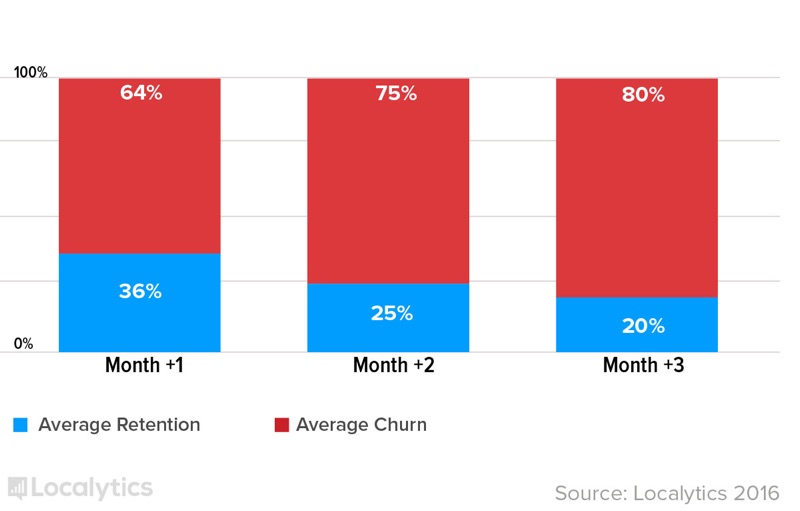
I also discovered a seminal post by Andrew Chen - ‘New data shows losing 80% of mobile users is normal, and why the best apps do better’ where he quotes figures that says that on average only 10% of users are still with an app 30 days later. That data is better for top 100 apps - 25%.
So based on that, we’ll set out goal to have M1 retention rate of 20%
Conclusion and Next Steps (taken in Early 2017)
So, based on the following research and thoughts we conclude the following.
Hypothesis: People like the idea behind Best in Town / Best in Edinburgh
Hypothesis validation: 20% of people who installed an app will come back to perform a critical action a month later
Critical action: opening a place
Next Steps
We've determined our hypothesis and how we're going to measure it. So, the next step would be to build an MVP, as minimal as possible, and get it to users.
I'll describe what will be included in the MVP in the next blog posts, which are coming out soon.
Reflections and Possible Mistakes
Writing this in Autumn 2018 I can spot the mistake I made when I setting the goals.
If you look at the Product Vision Board, you’ll see that the app serves two categories of users - Edinburgh locals and visitors. However, when I set the KPI to monthly retention I ignored the visitors group. If we have tourists and business visitors using the app, chances are they won’t come back to the app a month later, because they won’t be in Edinburgh. As a result, we won’t learn from them and they will even negatively skew the statistics.
Looking back, that’s one of the mistakes I’ve made. I didn’t know who my target audience would be. I catered for two - local population and visitors. But the KPIs were targeted only to the local population.
Additional Resources
- Mobile Apps: What’s A Good Retention Rate?
- New data shows losing 80% of mobile users is normal, and why the best apps do better
- AARRR vs. RARRA: Which is Better? - great post why it's more important to focus on retention, as opposed to acquisition
- Product Management & Analytics: what metrics should you be measuring?
- This post introduces a concept of engagement and transactional apps
The opinions expressed herein are my own personal opinions and do not represent my employer's view in any way. My personal thoughts tend to change, hence the articles in this blog might not provide an accurate reflection of my present standpoint.
© Mike Borozdin